Love Triangle – Matt Parker

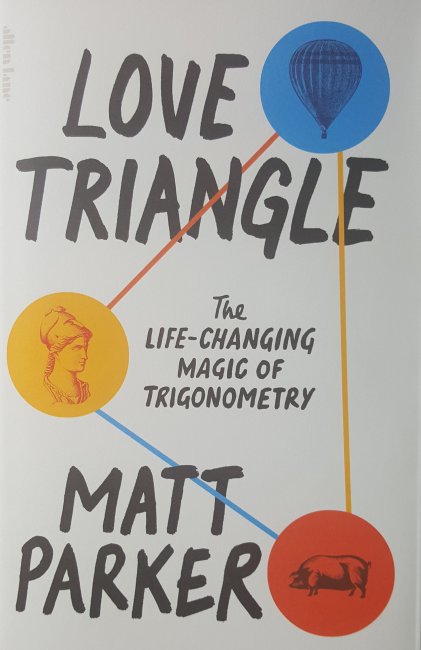
Yes this is a book about trigonometry, well actually it’s more about triangles and how important they are as we don’t get sines, cosines and tangents properly introduced until chapter seven entitled ‘Getting triggy with it’ which tells you all you need to know regarding the wordplay dotted throughout the book. I’ve covered one of Matt Parker’s maths books before, ‘Humble Pi‘ which deals with mathematical errors and like this book I bought it direct from Matt via his website which is full of things that no maths nerd should be without. The extra bonus of being one of the early orders is detailed below but of course the first extra you gain is that books ordered from the site are signed.

The first maths joke you encounter is the price which is £24.85 rather than the expected, and far more normal, £24.99 this is because 2485 is a triangular number of pennies, in this case a triangle with seventy coins on each side. If you’re not familiar with triangular numbers think of the snooker, or pool if you prefer, original setup with fifteen balls in a 5 x 5 x 5 triangle so fifteen is a triangular number with five on each side.

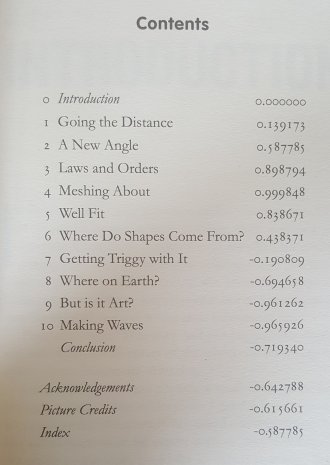
Below you can see the index and immediately you will spot something a little odd because, as he did in ‘Humble Pi’, the page numbering is a somewhat strange. In that book we start at page 314 and count down before hitting an overflow error and leaping up to a huge value, with this book the page numbers are the sine of the angle represented by the page number expressed to six decimal places so they start at zero range up to one and then slowly fall to minus one before rising again to -0.390731 (page 337 in a ‘normal’ book) and yes that does mean that most page numbers occur twice so finding things in the index is a little more tricky than you might expect, more on that later. I knew most of the maths covered in the book although I haven’t used trigonometry seriously for over forty years so a refresher course was interesting. I last had a practical use for trig about ten years ago when I was trying to hang sixteen pictures on a wall in a pleasing display of five on the top and bottom with six evenly spaced across the middle and needed to work out where all the nails should go, preferably before knocking holes in the wall.

The one ‘new’ formula that I hadn’t seen before, even though it is two millennia old was the truly ridiculous Heron’s formula, which gives the area of a triangle, normally expressed as ½ x base x height, but using only the lengths of the three sides a, b, and c without having to calculate the height. Instead you add the three values together, then add any two and subtract the third (for all 3 combinations) then multiply these four values together, extract the square root and divide by four.

Matt actually says “You might need to take a moment to sit down upon hearing that for the first time, I know I did”. Personally I was so confused by what appears to be a series of arbitrary calculations that I sat down and worked out some areas of triangles using ½ x b x h alongside Heron’s formula just to convince myself that it really worked.

And now we come to the index and here Matt has gone a little mad, in ‘Humble Pi’ the index gave the decimal position of the word you are trying to look up, so something given an index value of 23.5 would be half way down page 23. In this book Matt has gone for polar coordinates which is explained at the top of the index. This means that to use it properly you really need a protractor to determine the angle from the bottom left corner of the page. It would also help if he had somehow indicated which of the two possible pages had the page number referred to, for example the first entry ‘A Problem Squared’ is on the second occurrence of page 0.669131. Maybe a suffix r or f for rising or falling as you move along the sine wave of page numbers would work, in this case changing the page number, at least in the index, to 0.669131f

One fun section deals with British road signs that indicate the gradient of an approaching slope in the road. These are normally given as a percentage such as 20% for a 1 in 5 incline however apparently there are still signs which express the value as a ratio and Matt has deliberately left a gap in the text to insert a photo of him pointing at the sign as he fully expects readers who know where one of these is to tell him so he can go there.

Now onto the other reason for buying the book direct from Matt and that is the limited edition alternate covers available. Each of the first 8020 books bought from Maths Gear come with an extra cover with a special design and are all of these are initialled and numbered by Matt, see below.

To explain the extra cover I can do no better than to quote Matt’s website.

As a bonus for anyone who orders direct from me on Maths Gear, I have commissioned three (special, limited) × edition book covers as a collaboration between me and print-artist Paul Catherall. They’re pretty special. You’ll get one free while stocks last.

All books will be signed by me. All book covers will be signed and numbered by me. The first 1,001 orders will get a free “simplex edition” cover, the next 2,024 covers will be “tetrahedron edition” and the remaining 5,995 covers are the “triangle edition”. They will be assigned to orders in that order, so earlier pre-orders get the more-limited cover. Once the covers run out, people will have to be satisfied with just a signed first edition of the book.

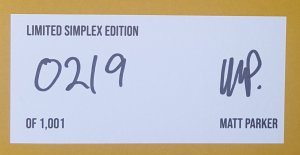
I was early enough to get number 219 of the simplex edition, a simplex is the expression of a triangle in n-dimensions, in two dimensions you get a triangle, in three a tetrahedron, in four dimensions it’s a pentachoron etc. At the point of writing this there are still limited edition covers available but you would have to make do with the triangle design. Sadly 219 is not a triangular number, coming between 210 and 231 however there had to be something special about the value and a bit of digging revealed that 219 is the smallest number that is the sum of four positive cube numbers in two different ways i.e. 1 + 1 + 1 + 216 = 219 and 27 + 64 + 64 + 64 = 219. Thanks to the On-line Encyclopedia of Integer Sequences.

If all of this mathematics has potentially put you off, don’t be. Matt is an excellent presenter of mathematical examples and you really don’t need much grasp of mathematics to follow the majority of the book and you may well learn something, even if it is the crazy formula first written down by Heron of Alexandria over two thousand years ago and which apparently is used today when doing the conversion of file format from a digital image on a phone or digital camera to something that can be printed. So something that ridiculous turns out to have a modern practical application, and yes it surprised Matt as well.

Dear reader, I need you to believe me that I had already written the chapter about triangle laws where I called Heron’s Formula stupid (because it is) when I read the official HP documentation for this technique, and came across the sentence ‘The area of a triangle is given by Heron’s formula’. I honestly just pushed back my chair, stood up and silently left the room, for a walk outside.

Mathematical Games – Martin Gardner

This week I’m going to cover not one but five books, all of which started life as articles in Scientific American under the heading of Mathematical Games. This column was originated by Martin Gardner in 1956 and I first came across it in my school library in the early 1970’s and became hooked, looking forward to the next monthly issue, which fortunately the school subscribed to. Eventually Gardner compiled fourteen books based on the column, five of which I own.

The first book has an unfolded flexagon alongside a mobius strip and immediately highlights the cover design issues with the Pelican editions in that although flexagons are the subject of the first chapter, the curious single-sided mobius strip is not referenced in this book. Flexagons were in fact the subject of the very first article Gardner wrote for Scientific American and are constructed by folding a strip of paper in a triangular pattern until you create a hexagon which when manipulated, or flexed, opens out and then returns to a hexagon shape but with different sides displayed. So if the user had coloured the original two visible sides these would disappear and new blank faces appear. It is possible to create flexagons with large numbers of faces but the number is always divisible by three. The book describes how to make a couple of different variations and I remember having great fun playing with them. Other chapters include the mathematical game of Hex, an overview of the puzzles created by American Sam Loyd, card tricks (Gardner was a keen magician as well as mathematics writer) and random collections of short puzzles which would be a staple of Mathematical Games columns and their successors in Scientific American.

The second book has a cover that is entirely from the imagination of the designer, in this case Denise York, as it has nothing to do with anything in the book which does however have an article about the five platonic solids one of which this definitely isn’t. Again we have an article about a great historical puzzle maker in this case the English near contemporary of Sam Loyd, Henry Ernest Dudeney, there are also discussions of three dimensional tangrams, magic squares, recreational topology and even origami. Like all the books I have each chapter is reprinted in the book and an addendum is added covering items that were raised after the publication of each column, sometimes pointing out things that were incorrect. Gardner surprisingly wasn’t a mathematician, or an academic, he was just fascinated by mathematical puzzles. Two of the people that continued the mathematics column in Scientific American after he retired in 1979 were professors Douglas Hafstadter and Ian Stewart.

The first two books were published by Pelican in the mid 1960’s but the next time they printed one of Gardner’s books was another pair, this time in 1977 and 1978. Again the the covers are not relevant to the text with the ancient puzzle of the Tower of Hanoi on the cover of Further Mathematical Diversions although this was in fact covered in the first book ‘Mathematical Puzzles and Diversions’ but this third Pelican title does have some of my favourite columns in it starting with the paradox of the unexpected hanging where the judge pronounces on the Saturday of the judgement that:

The hanging will take place at noon, on of of the seven days of next week but you will not know which day it is until you are informed on the morning of the day of the hanging.

The prisoner is despondent but his lawyer is pleased as he reasons that the sentence cannot be carried out because he cannot be executed on the Saturday as that is the last possible day and therefore he would know on the Friday that he was to be executed that day. Likewise it can’t be the Friday as Saturday is impossible so Friday is the last day and so on working back through the week. The logic is fine and worked right up until Thursday when the man was unexpectedly hung. The discussion on why the logic fails is quite entertaining.

Also in this book are articles on the transcendental number e, the properties of rotations and reflections, gambling, chessboard problems and numerous other subjects including the inevitable sets of nine short problems, but my favourite, because it prompted me to attempt to build one was about a ‘computer’ built of matchboxes and beads which could ‘play’ noughts and crosses (ticktacktoe) in fact the original article that this chapter was based on first appeared in Penguin Science Survey, a publication I was unaware of at the time I first read this article. The machine is more of a simple learning machine than a true computer but using three hundred matchboxes it is possible to have something that gradually optimises how to play the game and in the example described it was winning, or at least not losing the majority of games after just twenty goes.

The fourth book again doesn’t seem to have anything to do with the cover illustration but does have various articles including Pascal’s Triangle, infinities that are bigger than other infinities, the art of Dutch artist M.C. Escher, random numbers and a ‘simple’ proof that it is impossible to trisect an angle using just a compass and ruler although bisection is extremely easy. There are again many other subjects covered although unlike the other volumes there isn’t a chapter of nine short puzzles. I remember being fascinated by aleph-null and aleph-one infinities when I first read this piece as a teenager, the concept of ‘countable’ and ‘uncountable’ series resulting in differing ‘sizes’ of infinities was so different to what I was being taught in mathematics at the time that I needed to read it a couple of times to get my head around what was being explained and I have of course come to love the art of M.C. Escher.

The final book I have by Gardner is a hardback published by Allen Lane rather than paperback Pelicans although both are imprints of Penguin Books. It follows much the same format as the other four with twenty chapters based on articles from Scientific American but this time I don’t remember reading many of these before but topics include such diverse subjects as Fibonacci and cyclic numbers, the Turing test, devised by Alan Turing to determine if a machine could fool a human into believing they were conversing with another human. The smallest cyclic number is one that I have always remembered and it is 142,857, what makes it cyclic well just multiply it by 1 to 6 and see that the digits remain in the same order just starting from a different place i.e.

  • 142857 x 1 = 142857
  • 142857 x 2 = 285714
  • 142857 x 3 = 428571
  • 142857 x 4 = 571428
  • 142857 x 5 = 714285
  • 142857 x 6 = 857142

I’ve thoroughly enjoyed the mental workout reading these books again this week and remembering oddities of mathematics that have stuck with me since my teenage years and if you have any liking for puzzles I heartily recommend searching out Martin Gardner’s extensive output.

Fermat’s Last Theorem – Simon Singh

Published in 1997 as a follow up to a BBC documentary about the discovery of a proof of Fermat’s last theorem in 1994/5 this 362 page book takes a deep dive into the history of the theorem and the various attempts at a solution over the 358 years that it remained a mathematical puzzle. The joy of Pierre de Fermat’s last theorem is that it is very simple to understand but turned out to be incredibly difficult to prove. Anyone who has had Pythagoras’s theorem relating to the sides of a right angled triangle drummed into them at school will understand the basic concept. That theorem states that the square on the hypotenuse equals the sum of the squares on the other two sides or put simply in a diagram with the best known whole number solution as an example:

Fermat stated that although this clearly works for squared numbers, and indeed there are infinitely more combinations of whole number solutions (such as x = 5, y=12 and z=13 as 25 + 144 = 169) there are no whole number solutions if the power that you raise x, y and z to is greater than 2. Fermat stated that he had a proof, although he wrote this in the margin of his copy of the ancient Greek mathematician Diophantus’s Arithmetica and stated that ‘the proof was too large to fit in the margin’. Fermat was a mathematical genius but also extremely annoying as he would often taunt fellow mathematicians by writing to them that he had discovered a proof to some mathematical conjecture and challenge them to also find the solution and would rarely write down his own proofs in a rigorous manner. Certainly no example of Fermat proving his last theorem has ever been found. Fermat of course didn’t refer to it as his last theorem, it gained the name as slowly all his other conjectures were proved correct leaving just this one which would become notorious and also the driver of other mathematical insights as people tried to prove, or disprove, it over more than three and half centuries.

Let’s come back to that date of 1994/5 for the final proof. English mathematician Andrew Wiles had worked for many years on attempting a proof, but without admitting to his fellow mathematicians that he was working on it as it was seen as a waste of time and as a professor at Princeton University, New Jersey, USA it wouldn’t be appropriate to be seen to have an interest in the subject. However all that changed in the mid 1980’s when it was shown that Fermat’s last theorem would be effectively proved if there was a proof discovered to the seemingly unrelated Taniyama-Shimura conjecture. This conjecture deals with two extremely complex areas of mathematics and indicated that they were inter-related and indeed one could be used to solve problems in the other. These two concepts were elliptic curves, which were Wiles’s Phd speciality and modular forms, a four dimensional topological ‘structure’. Now I sort of understand the basics of elliptic curves but the use of modular forms is beyond me even with the basic description provided by Simon Singh in this book. Wiles saw this as a legitimate use of his time and would give him a proof of Fermat, which had fascinated him since he was ten years old, whilst working on a ‘genuine’ mathematical problem, the proof of Taniyama-Shimura. The problem was that this, like Fermat’s last theorem, was considered impossible to prove. He still decided to work in secret though and for many years came up against brick walls preventing his proof from working until in 1994 he took three lecture slots at a convention in Cambridge, England and under the deliberately opaque title of “Modular Forms, Elliptic Curves and Galois Representations” endeavoured to present his proof. The mathematical world was astounded and Wiles was hailed for his outstanding achievement, problems however were found during the rigorous checking before the proof could be published and it took several more months before Wiles finally fixed the error in his proof hence 1994/5 being given as the date of the solution. The 1994 proof was so close to being correct, but relied on another conjecture which it turned out wasn’t proved so proving this other theorem was what took the extra time.

Now it may well be, if you are still reading this blog, that you are thinking no way am I going to read this book it sounds far to complex but you would be wrong. Singh has done a remarkable job in not only summarising Andrew Wiles’s work and still making it approachable, but the history of the various attempts to solve Fermat is fascinating. I first read this book back in 1997 when it came out and have picked it off the shelves two or three times in the intervening decades and each time I love descriptions of the failed attempts and the progress, or otherwise, that they led to, along with the various other puzzles included which help to get your brain engaged in the problem. Each time I get that little bit further in understanding just what Wiles actually proved with the specific part of the Taniyama-Shimura conjecture (named after the two Japanese mathematicians who came up with it in 1957). Taniyama-Shimura would finally be proved for all variants in 2001 by four of Andrew Wiles’s former students and renamed The Modularity Theorem. A note on terminology conjectures are unproved but seem to work, theorems are fully proved

Give your brain a workout, I definitely recommend giving it a go.

Figuring: The Joy of Numbers – Shakuntala Devi

As a child I was fascinated by mathematics, but especially by tricks and shortcuts that could be done. I started reading Martin Gardner’s section of Scientific American when I was eleven or twelve years old, I don’t claim to have understood all of it but each month my knowledge of recreational mathematics was stretched just that little bit more. I’ll cover one or more of his books in a later blog. However in 1977, when I was fifteen, this book was published and it was written by somebody who, at least partly, earned her living from amazing feats of mental arithmetic, I had to get a copy, and this book is still on my shelves today. Some of it I already knew but there were whole sections where she explained how to do tricks that I had seen done but which had baffled me such as calculating the day of the week for any date given to you or working out square and cube roots in your head. I remember practising these tricks for hours until I could do them too.

The book starts of simply by looking at each of the digits 0 to 9 in detail, explaining what is special about each of them and giving tips around multiplying and dividing by them, patterns in their multiplication tables etc. She then moves on to chapters about multiplication, addition, division and a very short chapter on subtraction. These chapters not only suggest shortcuts, which I still use today, to perform such calculations but ways to quickly check if the answer you get makes sense such as casting out nines. The book really caught my attention however when we reach calculating squares, cubes, square roots and cube roots. Amazingly cube roots which non mathematicians would assume to be much more difficult then square roots are actually very simple and fifth roots are even easier, square roots proved to be quite tricky. But just to see how easy extracting a cube root lets look at all you need to know, worryingly forty five years later I can still remember this:

  • 1 cubed = 1
  • 2 cubed = 8
  • 3 cubed = 27
  • 4 cubed = 64
  • 5 cubed = 125
  • 6 cubed = 216
  • 7 cubed = 343
  • 8 cubed = 512
  • 9 cubed = 729

Assuming that we are starting with 474,552 (which is 78 x 78 x 78) how do you get the right answer? Well first of all look at the thousands i.e. 474, this comes between 343 and 516 so the first digit is the cube root of the lower number which is 7. Next you will notice that all the cubes in the list above end with a different number and you just need to find the one that ends with the same digit as the number you are trying to extract the root of which in this case is 2 which matches 512 or 8 cubed and there we have the answer, the 7 from the thousands value along with the 8 from the final digit gives the required answer of 78. Notice that it was simply a case of knowing the first nine cubes and no actual calculation was performed on 474,552 in order to get the right answer.

Calculating the day of the week is a bit more tricky as you need to memorise four tables, admittedly the first of which is simply the first four values from the seven times table so this barely counts as a table and the working out is also more involved. I can’t do this in my head anymore and frankly with the all pervading computers or mobile phones with calendars on them what was once a occasionally handy ability is now of no use whatsoever as you are rarely that far from a device where you can look up the day for a specific date if you need it. When I was a teenager however this was quite impressive at least amongst the other maths fans at school and I got to be pretty quick at it.

The book finishes with chapters on special numbers and finally tricks and puzzles most of which, even then, I had already encountered but this book stretched still further my mathematical skills and I loved it. It has been great fun reading it again and finding out what I remembered and what I had forgotten. Shakuntala Devi died at the age of 83 in 2013 and wrote several books on mathematics along with astrology and oddly ‘The World of Homosexuals’ which she claimed was inspired by her marriage to a homosexual man but Figuring: The Joy of Numbers is probably her best known work, at least outside India although sadly it appears to now be out of print. If you know a child interested in mathematics I suggest trying to get a copy for them, it really is a joy.

The Great Arc – John Keay

I’ve seen many a ‘trig point’ whilst walking the hills of Britain, these mainly concrete structures on top of high points were used for accurate mapping, specifically to get the correct height of hills and mountains, but quite how they were used was not something I particularly thought about before reading this book. The story John Keay tells is of an epic fifty year project to both start the accurate mapping of India but more importantly to create the longest ‘Great Arc of the Meridian’ a accurate calculation of the curvature of the Earth and it’s variation as you move from the equator to the north pole, one of the most outstanding scientific endeavours of the first half of the 19th century. Started in 1800 by a team led by William Lambton and ultimately completed by George Everest (pronounced ‘eve rest’ not ‘ever rest’ as he and his descendants would repeatedly tell people) the sheer scale of the project can be seen on the map below as a series of phenomenally precise triangles stretch all the way from the southern tip to India right up to the foothills of the Himalayas.

The basic concept is quite simple, first establish a baseline whose length is exactly known but is also long enough to mean that a high point visible from both ends will form a significantly different angle when this is measured by a theodolite from these two points. Using trigonometry you can then calculate the position of this third point and the length of the two inferred sides of the triangle formed. One of these ‘new’ sides can then become the base of another triangle, a new high point selected, measured and so on. It had already been established that the Earth wasn’t round like a ball but more like a grapefruit so flatter at the poles than at the equator but by just how much was it flatter. Measurements had been taken of the length of a degree (1/360 of the circumference of the Earth) and it had been found that in Ecuador (on the equator) it was approximately 111km whilst in Lapland it was around 110km so a whole kilometre shorter.

The problem lies in accurate measurement of a long enough distance, nowadays it is relatively easy but over two hundred years ago the equipment was a lot more primitive and Lambton had to use what was called a chain but was a lot more sophisticated than that. His was made up of forty bars of blistered steel each two and a half feet long and each attached to the next one using a brass hinge, using this he had a measure of one hundred feet (30.48 metres) that he knew to be correct, the problem comes when he needed a long enough base to his first triangle which he decided was a seven and a half mile long (12.07 km) flat stretch of land that needed to be cleared and levelled as much as possible near Madras. Which means that he had to use his chain four hundred times, precisely starting where the previous measure had finished, in a perfect straight line and allow for the expansion of the steel as its temperature rose under the Indian sun even though he only took measurements in the early part of the day. It would take fifty seven days to complete the seven and a half miles and the markers for the two end points can still be seen. From this line he could head north.

Now you have probably seen surveyors with theodolites at building sites but nothing like the giant piece of equipment Lambton used. It needed to be this size not only for stability but to allow for the large brass dials which would make the scale large enough to read extremely accurate measurements of the angles and even then the dials were fitted with microscopes so that the precise figure could be attained. Lugging this massive instrument across India, through jungles, deserts, up mountains and all sorts of other terrain never mind crossing rivers along with all the other equipment, food and tented accommodation for the entire vast team for months at a time was a stupendous achievement with people falling ill or dying both of sickness and animal attacks throughout the fifty years of the survey. Each time it was set up it had to be on a high point with other members of the team at another high point with a marker, initially flags and then later on lights and sometimes it would take weeks for the marker team to reach the next point, it was very slow progress with trees and in some cases houses or parts of whole villages having to be cut down or purchased and then flattened to provide clear sight lines from one point to the next. Six years after starting out a new base line was measured to check the calculated length with reality and amazingly over the six miles (9.66 km) checked the error was just 7.6 inches (19.3 cm) or to put it another way he was out by just 0.0000002%.

William Lambton eventually retired and was replaced by George Everest who carried the survey up to the foothills of the Himalayas but not into Nepal as that kingdom was going through one of its reclusive periods and they were not allowed in even to do scientific work. Besides it was known that the theodolite could see vast distances, possibly even into women’s quarters, and even worse the image seen was inverted and no man wanted his wife, or wives, seen upside down so they were often attacked by villagers or blocked by local rulers from coming through certain parts of India. This added to the geographic, animal and disease problems really slowed progress but Everest was not a man to put up with resistance to his survey and he pressed on regardless. He never saw the mountain that was to be named after him when it was determined to be the world’s highest peak; but nowadays whilst everyone has heard of Mount Everest, who has heard of George Everest? Tragically especially ignored is the brilliant William Lambton who started this magnificent survey so this book is important to raise their profile again. It is also a fascinating description of the hardships endured by the teams who did this amazing project. John Keay has produced a highly readable account of the survey which whilst including details as to how the work was done never gets bogged down in the mathematics which is a trap that would have been so easy to fall into. It was first published in 2000, mine is the 2001 paperback published by Harper Collins and is still easily available and I highly recommend it.

I is a Strange Loop – Marcus du Sautoy and Victoria Gould

A mathematical play, not a combination of words I ever expected to write and yet somehow it works. The authors are Professor of Mathematics at Oxford University Marcus du Sautoy and actress Victoria Gould who has a degree in physics and a masters degree in applicable mathematics. The play starts slowly with just one of the characters X on stage inside a large cube miming the drawing of two Platonic sequences, first the derivation of a regular hexagon using just a straight edge and a compass and secondly the proof of the irrationality of the square root of two using ever decreasing squares. Now this may not sound like riveting drama and frankly unless you know exactly what X is doing then it is very difficult to follow but X is about to have his whole world view changed by the arrival of the second character (or variable as they are referred to in the script) Y. Up until this point X has considered himself to be the only person and indeed the cube that he is in to be the only cube. Y however has travelled through millions of cubes and accumulated many things on her journey but is about to encounter her first ever other person, although she is surprised X is completely shocked by her appearance in his cube and through a couple of mathematical fallacies attempts to prove her non-existence.

OK this is probably sounding like a very niche production but believe me it is well worth sticking through the initial phases especially when we get to the second act which brilliantly turns the whole play on it’s head but more of that later. It also has to be the only play I have ever read that comes with a fourteen page guide to the maths in the play at the back of the book entitled A Mathematical Prompt Book. This is useful for the non-mathematician in explaining not only the maths but also some of the language used and functions very much like the glossary found at the back of some versions of Shakespeare’s plays. Would you get the joke about the Möbius script right at the end of the play if you don’t know what a Möbius strip is, probably not. But back to the first act. After Y demonstrates that there is a room, and in fact a series of rooms beyond the cube that X inhabits X then believes that the series must be infinite and tries (and fails) to prove this just as he also fails to physically prove other infinite series simply because, as Y points out, there are limits that prevent such physical proofs. All attempts to find an OUT, a place beyond the cube series also fail.

The second act is completely different and the humour of the piece grows, that’s not to say that the first act isn’t funny, the interactions between the purely mathematical X and the more practical Y are definitely amusing but the second act introduces reality is an very unexpected way. Right from the start of the second act Y believes the play is over and indeed no longer calls herself Y but instead uses her real name Victoria, X however is still very much in character. Victoria makes various attempts to disabuse X of his belief that the play continues including showing him that it is possible to leave the stage, go round the back and come back in from the opposite wing. She explains that the seemingly random noises heard during the play are the sounds of the underground trains near the theatre (there really was the sound of the underground where the play was first staged at The Barbican Pit Theatre in London) and she even produces a model of the set to show X that it is simply a stage. Nothing works and instead the play finishes almost back where it started. It really is very funny, both in the absurdity of the position that the characters find themselves in throughout the play and their changing relationships but also the increasing frustrating part of Victoria as the play is forcing itself back around her even as she believes she has finished.

The entire play can be seen here in a performance filmed at the Oxford Playhouse where the two parts are taken by the authors showing a surprisingly good acting ability from du Sautoy especially in what has to be described as experimental theatre. At one hour and fifteen minutes into the video the play is over and we go to a three quarters of an hour discussion about the play with Marcus du Sautoy, Victoria Gould interviewed by Simon McBurney, founder of Complicité, the theatre group responsible for the performance and which Gould is closely linked to. It’s definitely worth watching the play and it is considerably less intimidating knowing that the over two hour runtime of the video represents almost twice the length of the actual performance. Give it a go…

Professor Stewart’s Cabinet of Mathematical Curiosities – Ian Stewart

After a series of novels, time for something factual and an exercise for the brain. Ian Stewart was Professor of Mathematics at The University of Warwick when he wrote this book in 2008 and still holds that title although now Emeritus since he retired. He has written numerous books on mathematics, several of which I own so this was chosen as the first one I picked off the shelf, he was also the third person to write the recreational mathematics column for the periodical Scientific American, taking the reins from 1991 to 2001. This column was started by Martin Gardner back in 1956 and he wrote it until the mid 1980’s and this was the true start of my love of mathematics so it has been a pleasure over the years to have sat in a few bars with Ian and discuss maths and also to enjoy his very readable books.

This book, along with it’s sequels Professor Stewart’s Hoard of Mathematical Treasures’ from 2009 and ‘Professor Stewart’s Casebook of Mathematical Mysteries’ from 2014, are an interesting mix of puzzles and mathematical history and are partly built upon notebooks that Ian started whilst still at school and more snippets that he has gathered over his long career of anything that looked fun or interesting in the field of mathematics. I had come across roughly half of the puzzles before and it’s surprising it was so few as I have lots of maths puzzle books but the 249 pages of puzzles and essays plus 60 pages of solutions and/or further further discussions on points raised contained a lot that was new to me. Of the essays I particularly liked his short summary of Fermat’s Last Theorem and how Andrew Wiles finally came to solve it centuries later. Ian demonstrates his skill as a good teacher in these essays, not simplistic, after all anyone picking this book up will have an interest in mathematics but not too complex either. The solution relies on a whole new branch of mathematics so he doesn’t try to explain how the solution works but instead explains why it is important and hints at the complexity involved. There are also essays on fractals, chaos theory, various famous mathematicians and numerous important conjectures and theorems spread throughout the book.

It is in the puzzles though that Ian allows his wit to shine through, even if sometimes that is just a series of bad puns as in ‘The Shaggy Dog Story’ which is a fun rewriting of a really old puzzle that would be familiar to almost all readers of the book so he dresses it up to still make it fun and then in the solutions section introduces a variant of the puzzle which I hadn’t come across before. The puzzle involves the terms of a will where the eldest son is to have a half of his fathers dogs, the middle son a third and the youngest a ninth. Unfortunately when the father dies he has seventeen dogs so the division looks like it could be quite messy if the will is to be executed exactly. The solution is actually quite easy and I first saw this puzzle over forty years ago but I’d never seen the follow up question which can also be solved where the legacy of the first two sons remains the same but the third son gets a seventh of the dogs and the puzzle is reversed because you have to work out how many dogs the father had in order for there to be a solution with no dogs harmed. If you haven’t seen the original puzzle before I’ll put the answer at the end of this blog.

I’d recommend this book to anyone with an interest in maths, the essays are fascinating, the puzzles fun and you’re guaranteed to learn something new.

I also have both the subsequent books in this style and there is an interesting part to the introduction of the second book, I’ll reproduce it here.

Cabinet was published in 2008, and, as Christmas loomed it began to defy the law of gravity. Or perhaps to obey the law of levity. Anyway, by Boxing Day it had risen to number 16 in a well known national best seller list, and by late January it had peaked at number 6. A mathematics book was sharing company with Stephanie Meyer, Barack Obama, Jamie Oliver and Paul McKenna.

This was, of course, completely impossible, everyone knows that there aren’t that many people interested in mathematics.

Ian therefore unexpectedly received an email from the publisher wanting a sequel which did well, but not as well as the first hence the longer delay before the third book. The Casebook is easily the weakest of the three as too many puzzles are dressed up in cod Sherlock Holmes stories which frankly only serve to pad out the puzzle and it appears to have been remaindered as I didn’t know it existed until planning to write about the first two and got a brand new still shrink wrapped first edition copy for a third the original price seven years after it originally came out.

Dogs problem solution – You just need to borrow a dog from somebody else. This will mean you have 18 dogs, half of that is 9, a third is 6 and a ninth is 2. As 9 + 6 + 2 = 17 you can then give the borrowed dog back, Now try the follow up question…

Humble Pi – Matt Parker

Subtitled ‘A comedy of Maths Errors’ this book looks at mistakes not only with mathematics but also some dodgy computer programming and some problems that fall in between like the fact that an employee kept disappearing from the company database and it turns out that his name was Steve Null. I used to be a programmer and more importantly for this example a Database Analyst so immediately saw the problem here, empty fields which should be populated are counted as Null in a database so you would search for Null entries and delete the records as they are clearly not filled in correctly and could cause processing errors later down the line, this person was actually called Null so kept being deleted.

Matt Parker is the Public Engagement Mathematics Fellow at Queen Mary University of London, amongst many other things, and has made a career out of explaining mathematics to the general public both on youtube and in highly successful theatre based tours. He started out as a maths teacher in his native Australia but has lived in England for many years and built his online presence here. The book is not only informative regarding maths errors and possible pitfalls but includes several mathematical jokes in its layout such as starting at page 314 and counting down which is clearly not normal behaviour for a book. The choice of 314 is deliberate as Matt is well known for his annual calculations of pi in different ways on pi day (American format dates for the 14th of March gives 3.14) including one idea for this which uses the actual book I’m reviewing to calculate pi.

Other ways he plays with the normal structure of a book include having a chapter 9.49 between chapters 9 and 10, which appropriately covers problems with rounding errors, and the index which is surprisingly accurate as not only do you get the page with the entry on but as it is to five decimal places you get the location of the word you searched for.

Some of the errors I had come across before but surprisingly not many, this is a really well researched piece of work. One I hadn’t heard of in the past is now rapidly becoming my favourite mistake because it was so close to being right and then fell over at the final hurdle. There was a bridge being built between Switzerland and Germany and to save time it was decided to start from both sides and meet in the middle. Clearly this is a good idea but you do need to actually line up perfectly so the maths is even more vital than normal for an engineering project. There is a problem with matching heights and that is that they are calculated ‘above sea level’ now that wouldn’t be an issue if sea level was constant (it isn’t, the curvature of the Earth amongst other factors sees to that) but also Switzerland does not have a coast but via a fairly convoluted route uses the Mediterranean Sea as its base point. Germany does have a coast but a long way from Switzerland on the North Sea. The engineers thought of this however and correctly calculated the difference as 27cm, which is pretty impressive (a) to think of it and (b) to get it right but then added the 27cm to the wrong side so the bridge missed its joint by 54cm.

If this post intrigues you Matt has done a couple of lectures based around the book and this is the link to the one he gave at The Royal Institution in London last year. In it he goes through several examples in the book including a section near the end where his wife, space scientist Lucy Green, brings into the lecture hall what remains of a satellite blown to pieces and dumped in a swamp after a simple maths error. You can’t easily get a more dramatic, or indeed more expensive example of maths gone wrong than that. I bought the book from Matt on his website so it is signed by him and yes I have posted this a day late from my usual Tuesday and between 7pm and 8pm rather than 7am and 8am to show that getting a number wrong is all too common and Matt also left in three errors for exactly that reason.

How to Lie with Statistics – Darrell Huff

20200623 How to Lie with Statistics

I bought this book many years ago when I was employed by the accounts department of a large UK firm to analyse the figures and produce reports for the board of directors on performance of all aspects of the business not just financial. Now you may think that purchasing a book entitled How to Lie with Statistics would suggest that these board reports may not have been entirely accurate; but in fact I got it for the same reason as it was written because if you know how things can be done badly then you can avoid making the same ‘mistakes’. Unless of course you are trying to show something, or more likely hide something, in the numbers, in which case the book becomes even more useful as a source of helpful hints. Rereading it at a time when we are bombarded with statistics and graphs (oh how a lover of selective data loves graphs) relating to the global pandemic of Covid-19 adds a useful dose of cynicism which we could all do with and the cartoons by Mel Calman are as pointed as they so often are.

Averages and relationships and trends and graphs are not always what they seem. There may be more in them than meets the eye and there may be a good deal less.

The book is full of examples of misleading statistics either real ones or created data to illustrate a point, for example just what is an average? Now the lay person reading that the average of something is say five will assume that tells you something, but which definition of average is being used? There are after all three main types all of which can give wildly different results depending on what you want to prove. The mean is what most people assume is an average that is add up all the numbers and then divide by how many numbers are in the sample. But then there is the median which is simply the middle number if you write out the data in numeric order, now this is useful for getting rid of weird data in the sample, the series 1, 3, 3, 5, 7, 9, 147 has a median of 5 which is ‘probably’ more useful than the mean of that data set which would push the ‘average’ much higher than all but one of the numbers in the set but it can also be misleading if that answer of 147 turns out to be important and you have simply ignored it. The only other average most people will come across is the mode, now that is simply the number that occurs most often so in the previous example that would be 3. So is the average 3, 5 or 25? Well it depends what you want to prove all of them are legitimate averages. In the book Huff uses a similar example where the data is household income, if my sample is also monthly income in thousands of pounds then all we have proved is that this particular group probably includes a professional footballer on £147,000 a month. Saying that the average is £25,000 a month is meaningless unless you want to imply that this is a particularly wealthy neighbourhood to property investors that haven’t been there but under one definition it is the average income, so should they build a Waitrose or an Aldi supermarket?

Each chapter features different ways of presenting data starting with samples with built in bias. A postal survey asking if people like filling in postal surveys may well show that 95% do, but unless you also know that they sent out 100,000 surveys and only got 250 back you don’t see the 99.75 percent of people polled that so dislike filling in postal surveys they simply threw it away. A famous real example of this mentioned in the book is The Kinsey Report on the sex lives of Americans in the 1940’s and early 1950’s. This report claimed to be revolutionary and is still cited but how many people back then were going to be willing to take part in the survey? By the nature of the responding sample we have another self selecting group biased towards people who are more open about their sex lives and preferences and may also on that basis be more experimental therefore skewing the results.

But to really lie with statistics you need a graph which is why politicians and marketing departments love them so much, one of the examples in the book is reproduced below and shows a oft repeated trick to make figures look more impressive, truncating the vertical axis, both graphs show the same data but have a different title to reflect what the story is.

20200623 How to Lie with Statistics 2

Another popular trick with graphs is to start or stop the range displayed to avoid including inconvenient data, if a graph based on monthly figures doesn’t start in January or maybe starts in 2007 (which seems an odd year to choose unless mapping something that did actually commence then) always ask the question what were the figures that preceded those displayed, likewise if it appears to stop at a random point then that is probably where the data stopped matching whatever the person drawing the graph wanted to prove.

Percentages are also to be looked at carefully, percentage of what precisely is always a good question. If something is £10 now and £15 next year it is 50% more expensive but the reverse isn’t the case, something £15 and £10 next year is 33% cheaper however it’s amazing how often you see the figure of 50% being used, an example is of the president of a flower growers association in the US who claimed flowers are 100% cheaper than they were last year, what he meant was that the price last year was 100% higher than now, if they were really 100% cheaper they would have to give them away. There are lots more examples in the book and you don’t need any mathematical knowledge to understand any of them, Huff is really good at explaining just why you should be always looking twice at any statistic and the more simplistic the way it is presented then the more cynical you should be.

Darrell Huff wrote this classic back in 1954 and it was then published by Victor Gollancz and first editions now sell for many hundreds of pounds. This is the 1973 first Pelican Books edition and it was Pelican that commissioned Calman’s drawings and is much more reasonably priced. It doesn’t appear to still be in print but copies are easy to find on the secondhand market. Now more than ever this book is needed.

20200623 How to Lie with Statistics 3


Mathematics in the Time of the Pharaohs – Richard J Gillings

20200421 Egyptian mathematics 1

There are four extant sources for this book, the Egyptian Mathematical Leather Roll (EMLR), the Reisner Papyri (RP), the Moscow Mathematical Papyrus (MMP) and the most important The Rhind Mathematical Papyrus (RMP) which was actually a training manual for scribes. Because it is there to teach this final papyrus document is crucial to our understanding of how the ancient Egyptians performed their calculations. This document along with the EMLR are in the British Museum in London, the RP is in the Boston Museum of Fine Arts whilst the MMP is in the Pushkin Museum of Fine Arts in Moscow, as you would expect from its name. Gillings wrote his book in 1971 and one or two errors have since been noted in the mathematical press as further studies have been made of the four sources and almost fifty years have passed since he wrote it, but these are largely technical and the book is mainly correct especially in its overview as to how ancient Egyptians calculated and is pretty comprehensive. Having said that it is definitely not a book for the layman, it is pretty solid mathematics and I would suggest that there is still a gap in the market for a simpler presentation which would introduce those with a curiosity in the subject to more easily come to some understanding as to how this worked.

Ancient Egyptian mathematics was largely overlooked and dismissed by scholars as simplistic especially when compared to that of ancient Greece but that overlooked the fact that it was more than capable of calculating the dimensions of the pyramids. For instance if you want a pyramid 139m high (the size of the Great Pyramid at Giza) just how big a base do you need to start with? It has also ensured that they still haven’t fallen down thousands of years after construction. Also the Egyptians had a large empire, so built irrigation canals, large granaries and temples, and of course had a comprehensive tax system to pay for all this so they must have been highly capable at least in the field of applied mathematics and engineering.

But let’s start at the beginning with the hieroglyphic representation of numbers, one is simply a vertical line, two is two of these and so on until you have nine lines drawn together to represent nine. Now this is easy and like all tally marks rapidly becomes unwieldy so you need symbols to indicate larger numbers and the earlier forms of these are shown below. I love the symbol for a million which appears to be the scribe throwing his hands in the air as if to say wow what a big number, what do I do with this?

20200421 Egyptian mathematics 2

In fact the papyrus scrolls were written in hieratic script which is sort of cursive hieroglyphic and is much more difficult to read and it is also important to note that they wrote right to left just as in modern Arabic so to our way of looking at it you would see the units first, then the tens, hundreds etc. There is a quick way of remembering this as animals or birds used in hieroglyphic writing always look towards the direction the writer. In the scrolls we have available to modern study addition and subtraction are regarded as so simple as to not need to show any working out which is unfortunate as this means we don’t actually know how they did it, you just get the required sum and then the answer. However everything beyond that is included and it should be understood that the ancient Egyptians managed their entire means of calculation by merely being able to multiply and divide by two and for reasons that are too complex to go into in this blog they also had the 2/3 times table (usually written down rather than memorised) and used this so extensively that when they needed to find a third of a number they would first get two thirds of it and then halve the answer.

So how did they multiply? Well the example given in the book is for multiplying 7 by 13 and this was done as follows. Start by writing two columns, the first of which has a 1 in it and the second has one of the numbers to be multiplied (this is the second example in the book as I think it is better to understand than the first). Under each number double the figure above until doing so in the column starting with one you would have a number larger than the number you are trying to multiply.

20200421 Egyptian mathematics 3

Simply adding up the values opposite the checked values in the first column gives the answer to 7 x 13 which is 91. If the number in the first column isn’t needed to sum to 13 in this case then you simply ignore the corresponding number in the second column. It’s simple really. Division is done the same way but a scribe asked to divide 184 by 8 would instead ask himself how many times do I need to multiply 8 to get to 184 so would create a similar chart to the one above.

20200421 Egyptian mathematics 4

Now at this point you hit the issue of fractions which we know that they understood as they had the 2/3 table but the way the ancient Egyptians handled them is definitely beyond me being able to explain here, I will simply say that with the sole exception of 2/3 they did not have any fractions with numerator other than 1, so to express ¾ for example they would write the equivalent of ½ + ¼. As you can imagine this becomes extremely messy very quickly. But the way they expressed a fraction, especially in hieratic is interesting as they drew a line over the number to indicate that it was a fraction and as the numerator was always 1 they didn’t need to show this, two thirds had it’s own specific character so that didn’t cause confusion. Later mathematical systems simply added a numerator above the line to indicate multiples of the denominator so this is where our way of writing fractions almost certainly originates from.

I only want to include one further example from the book and this one I chose as I particularly liked the calculation. I do recommend seeking out this book or the various online papers now available on the subject if you want to take this interesting branch of mathematics further. The calculation is how did they work out the area of a circle? Now courtesy of the ancient Greeks and their discovery of geometry (Euclid in particular) we know that the area of a circle is the square of the radius multiplied by the irrational number π which is 3.14 to two decimal places and that will do for most calculations. Archimedes worked it out to about that in 250BC but that is over 1300 years later than our poor scribe in ancient Egypt so how did he do it?

Well their calculation as given in problem 50 of the RMP is to take the diameter, work out a ninth of that figure, subtract that from the original number and then square the result. The sample problem takes a circle with a diameter of 9 khet (which makes the maths a lot easier), so if the diameter is 9 then a ninth of that is 1, subtracting that from the diameter gives 8. Multiply 8 by 8 as we know how to do above and that gives 64 setat as the area of the circle. It’s a hell of a big circle though as a khet is about 57 yards (roughly 52 metres) so a single setat, or square khet, is roughly 3250 yd² or 2720 m². But how accurate is the result of 64? Well (4½)² x π, which is our way of doing the calculation, gives 63.62 so it’s pretty good. If I ever needed to work out the area of a circle in my head (oddly something I don’t do often) then the ancient Egyptian way is definitely the way to do it, no messing around with π needed.

I was intrigued, so some basic algebra (also not something I do every day anymore) shows that the way the calculation works means that their equivalent of π is 256 / 81 which is 3.16 to two decimal places which explains the accuracy. It is also by far the simplest calculation that is remotely accurate as simply subtracting a ninth from the diameter is very easy. I spent a little more time with a calculator and found that the next easiest fraction that gives a better result is to subtract 4/35ths  which is lot more difficult than dividing by 9.

There is considerably more in the book for a keen mathematician to have fun with such as calculations of volumes and of course the all so important dimensions of a pyramid and truncated pyramid (i.e. one still under construction). So once you can get past the slightly confusing way it is written it’s fun to work through, preferably with some paper and a pencil nearby to do some quick calculations of your own.